Influenza USA - Forecasting (Case Study)
Motivation:
The influenza season in the United States is characterized by a notable increase in the number of individuals affected by the flu. Certain populations, particularly those deemed vulnerable, are at a higher risk of developing severe complications that may necessitate hospitalization. Hospitals and clinics often require additional staffing resources to provide adequate care for these patients. Medical staffing agencies are crucial in supplying the temporary personnel needed to fulfill this demand.
Objective:
Determine when to send staff and how many to each state.
To support medical staffing agencies in the provision of temporary healthcare professionals to hospitals and clinics during periods of heightened demand for additional personnel.
WHEN IS INFLUENZA SEASON?
Which population groups are the most vulnerable?
Individuals aged 65 and older are at a significantly higher risk of developing severe health conditions and experiencing flu-related deaths. For this project, we will focus specifically on this age group.
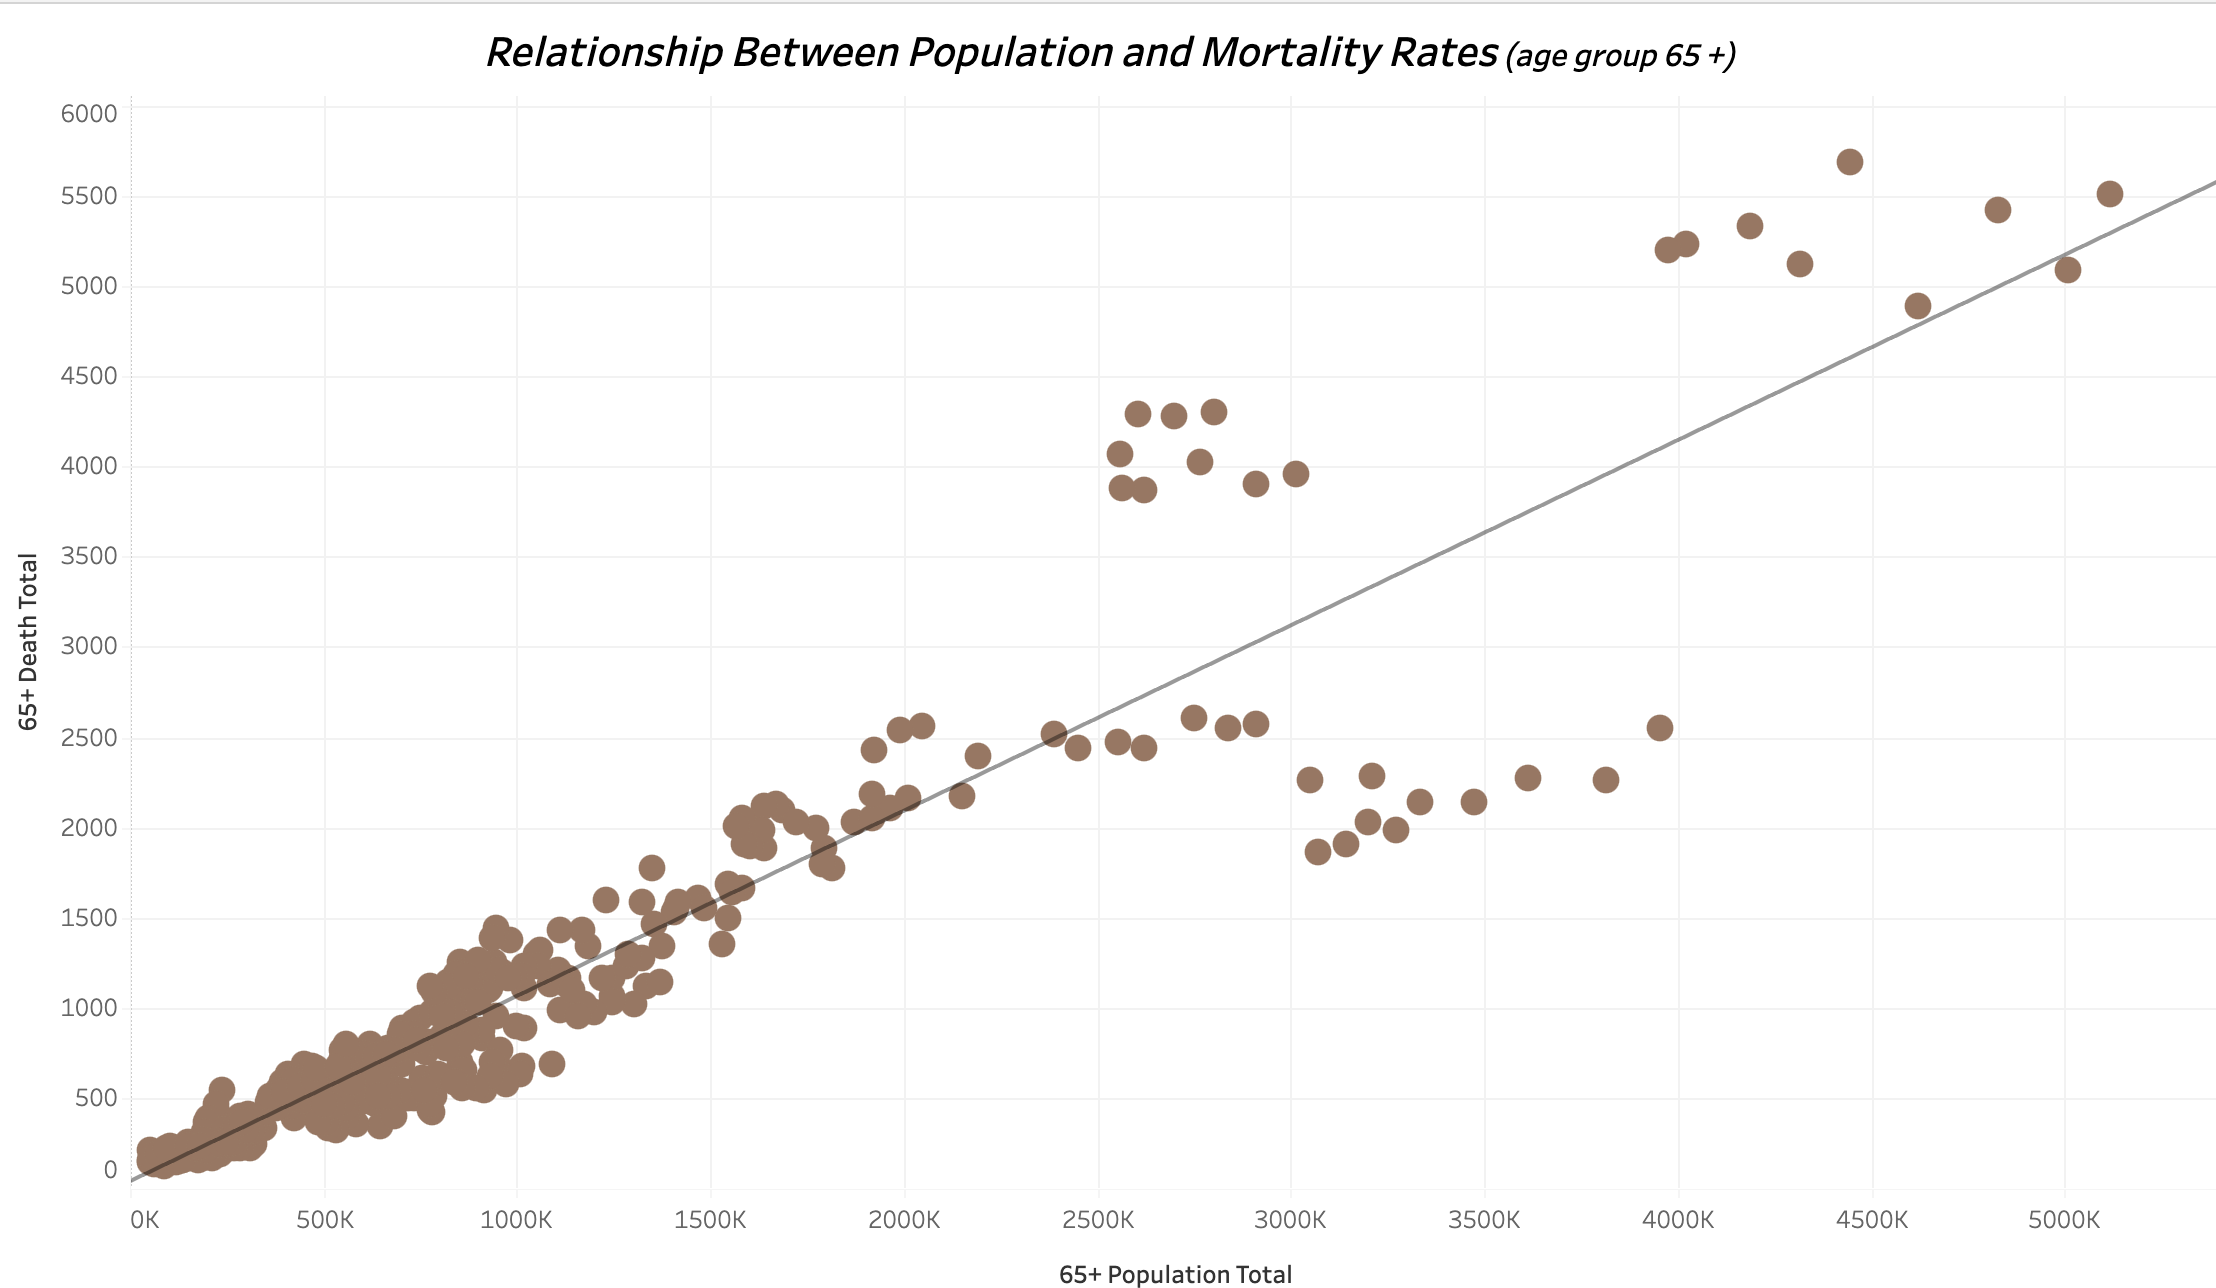
As the population of individuals aged 65 and above continues to increase, the number of influenza-related deaths is also expected to rise. This will require additional medical resources to address the growing number of deaths in their respective states.
Key Insights:
A fascinating nine-year study highlights that influenza-related fatalities are particularly high in certain Southern states, including New York, Texas, and Florida.
The influenza season spans from October to May, peaking between December and March when fatalities significantly rise. Interestingly, California experienced the highest number of flu-related deaths with 54,000 recorded during this time.
The years 2013 and 2015 were especially notable, showcasing a surge in influenza cases. By staying informed and taking proactive measures, we can all contribute to reducing these numbers and improving community health!
WHO IS VULNERABLE?
Hypothesis Testing
Hypothesis:
"If the population is over 65 years old, they are at a higher risk of dying from influenza than younger age groups."
Null Hypothesis:
"IF individuals are aged between <1 and 24, they are at a higher risk of death outcome to influenza infection."
Alternative Hypothesis:
"If a person is over 65 years old, their likelihood of dying increases significantly compared to those under 24."
Comparing the p-value when rounding up came to 0, resulting in individuals below the age of 65+ having a random chance of death outcomes due to I influenza as the significance level of 0.05 was not exceeded, compared to a population 65+ older who has a higher mortality rate. "We can confidently reject the null hypothesis.
WHERE INFLUENZA IS MOST PREVALENT?
The pattern of influenza outbreaks during the 2018 season is predicted to be similar to that of 2016 and 2017. This implies that the timing, duration, and intensity of the flu outbreak 2018 will be comparable to the previous two years.
Based on the map observation, 12 states have the highest number of vulnerable populations affected by Influenza.
These states have the highest percentages of adults (over 65) considered vulnerable.
Therefore, it is imperative to provide additional staff in these states to address the increased demand for medical attention.
Conclusions and Recommendations:
Recommendations:The influenza season fluctuates across different states, exhibiting consistently higher mortality rates in the southern regions. The peak period for influenza typically occurs from December to March.
Individuals over 65 are at a higher risk of influenza infections due to their health conditions. Trends for this age group increased in 2017 and are expected to remain the same in 2018.
In some cases, deaths might be noted as pneumonia or other respiratory issues, often without revealing that the underlying culprit was a flu infection.
Recommendations:The flu ranking shows which areas have higher flu rates, meaning their populations are more vulnerable. These states have more adults over 65 at greater risk of severe problems from the flu. Therefore, concentrating efforts on these regions can help better protect and support these at-risk populations during flu seasons.
The allocation of temporary staff should prioritize areas with high populations of vulnerable individuals, ensuring that assistance reaches those in greatest need.
What's next:Vaccination campaigns should highlight the importance of vaccinating vulnerable individuals to prevent and reduce influenza mortality rates.
Educate the public about influenza, including its symptoms and preventative measures. Additionally, promote good hygiene practices to help reduce the spread of the virus.r
Hospitals and healthcare facilities prepare for increased influenza activity during peak seasons by ensuring adequate staffing, medical supplies, and equipment to manage the potential surge in flu-related cases.
Data Limitation:
The suppressed value represents a missing value, resulting in inaccurate data. Inadequate manual data collection may bias influenza data due to human error, misspellings, and underreporting.
Population data is categorized by geography, time, age, and gender. It's important to understand that our data only includes a single cause of death listed on each death certificate. This means the true impact of influenza may be underestimated, particularly in cases where influenza is present but another primary cause is recorded. Additionally, confidentiality concerns may prevent the reporting of statistics for groups of fewer than ten individuals (0-9), which could lead to inaccuracies in the data. Furthermore, delays in reporting influenza cases may affect the timeliness of the information.
Census data collection relies on estimates and does not comprehensively represent the entire national population. The accuracy of this data cannot be assumed to be precise, and there may be instances of both undercounting and overcounting of populations in various states. This discrepancy can lead to data characterized by missed or duplicated entries, which may introduce potential biases. Furthermore, estimates of population figures and data obtained from surveys can be both inaccurate and incomplete. It is noteworthy that while individuals under the age of five are categorized together, the specific number of individuals within this demographic remains indeterminate.
Dataset
Source:
Influenza deaths by geography, time, age, and gender Source: CDC
Population data by geography Source: US Census Bureau: Census_Population


